Every year I like to provide an update on my solar generation, electricity usage, month electricity cost and a few other metrics. If you would like to look at previous years here are the links
Here is chart of our overall usage for the year. We definitely ended up using more solar from our electric provider this year then any year in the past 5 years.
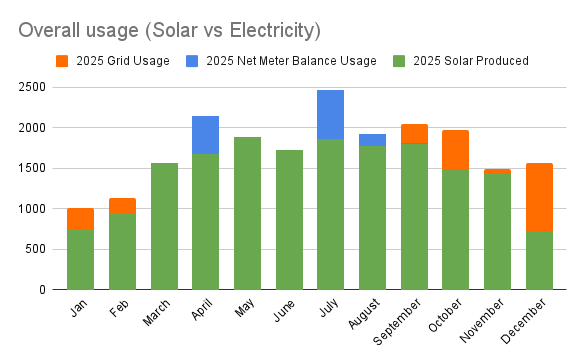
Since Alliant’s bills are not actual calendar months, this data is roughly from Dec 20th 2024 to Dec 19th 2025. Here are some highlights of over the year
- 1) The system produced a total of 17.598 MWh slightly more then 2024, about the same as 2023
- 2) Actual production was about 14% higher then the original estimate.
- 3) Our household usage increased 4% compared to 2024 and 13% compared to 2023.
- 4) Our average electric bill for the year was $42.32
- 5) Our most expensive month was Dec, totaling $147.32.
- 6) We bought a inflatable hot tub in 2023 and it uses a ton of electricity. We had the hot tub setup between June and October. With July being a warm month and the hot tub, I am guessing that is why our peak in July was our highest electricity usage ever in a month.
- 7) Current Rate of Return is down to 6.25 years (about 3 months less then what I calculated last year). This calculation includes previously received tax rebates.
- 8) We got a new hot water heater at the end of May of this year and it was the same size, but different brand so might have some impact to electricity usage.
Here is a chart for Electricity bought vs solar produced and sold back to the electric company and the net meter balance each month. As you can see my net meter balance didn’t grow over the summer to go into the winter.
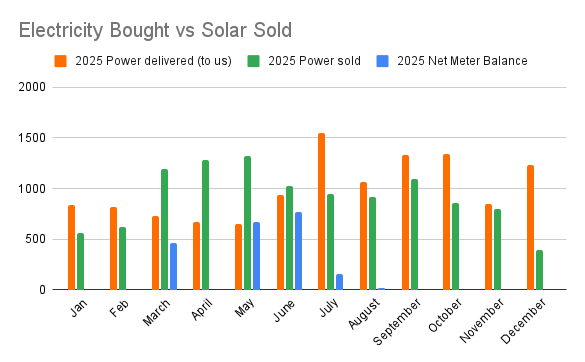
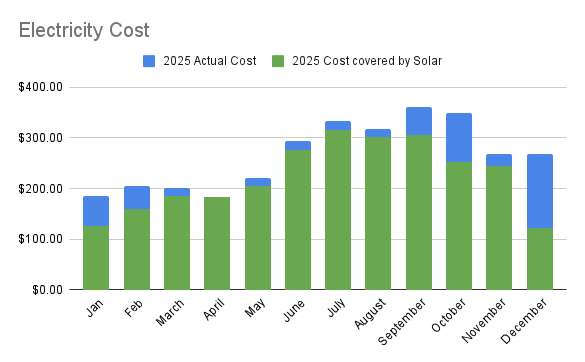
Chart shows overall month cost if we didn’t have solar and how much is covered by solar.
This chart shows overall usage month to month, how much solar we should make, and how much solar is produced. As you can see the summer months are higher then the winter months. Overall month to month we are still producing as much as they estimated when we signed up.
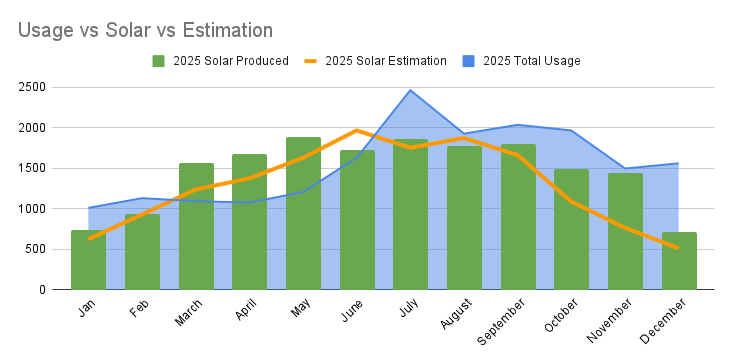
This past year of solar data shows the system continuing to perform better than expected, even with higher household electricity usage. The system was originally sized to provide a 99% to 100% offset, and based on current numbers we are coming in at roughly a 94% offset overall. Using an average electricity rate of $0.11 per kWh, that puts our annual savings at about $1,500. Hope you enjoy the yearly solar data dump.
One thought on “2025 Annual Solar Transparency Report”