Just received my December bill from Alliant Energy, so now I can share our solar production and electricity usage over the last year. Since Alliant’s bills are not actual months, this data is roughly from Dec 20th 2021 to Dec 19th 2022
A few notes and observations about the year:
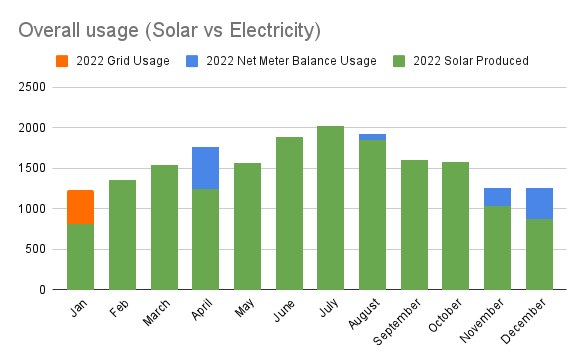
- 1) Produced a total of 17.356MWh (7% more then 2021)
- 2) Produced about 12% more then the overall estimate.
- 3) We used 5% more electricity this year, compared to 2021

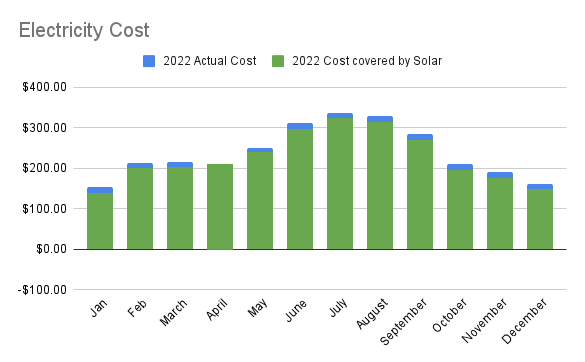
- 4) Our average electric bill was $12.29
Here is a chart for Electricity bought vs solar produced and sold back to the electric company and the net meter balance each month.
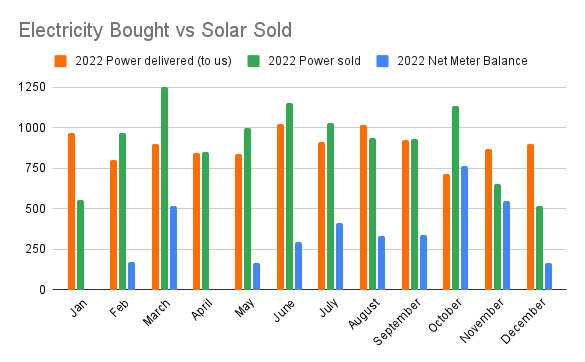
Chart shows overall month cost if we didn’t have solar and how much is covered by solar.
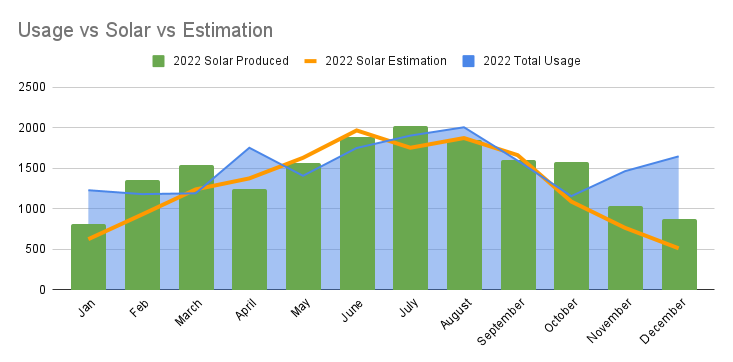
This chart shows overall usage month to month, how much solar we should make, and how much solar is produced. As you can see the summer months are higher then the winter months.
Here is a link to last years data – https://akschaefer.com/2022/01/22/this-post-is-about-solar-2021-annual-solar-transparency/
Happy sunny days!
2 thoughts on “2022 Annual Solar Transparency Report”