Every year I like to provide an update on my solar generation, electricity usage, month electricity cost and a few other metrics. If you would like to look at previous years here are the links
Since Alliant’s bills are not actual calendar months, this data is roughly from Dec 20th 2023 to Dec 19th 2024
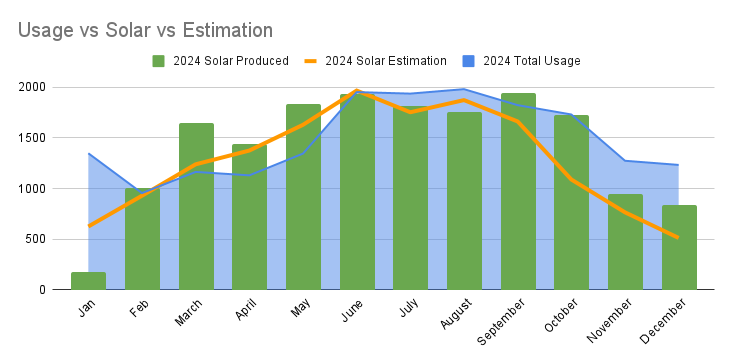
- 1) Produced a total of 17.027MWh (Roughly the same as 2023)
- 2) Produced about 10% more then the overall estimate.
- 3) We used 10% more electricity this year, compared to 2023, 🤐however it was below our 2022 total usage yet.
- 4) Our average electric bill was $20.80 with the most expensive month was $75.77 (Winter months produce less solar and we are carrying over less in our net meter balance)
- 5) We bought a inflatable hot tub that was electric and used ate into our net meter balance.
- 6) Current Rate of Return is still at 6.5 years when taking into account the tax rebates.
Here is a chart for Electricity bought vs solar produced and sold back to the electric company and the net meter balance each month.
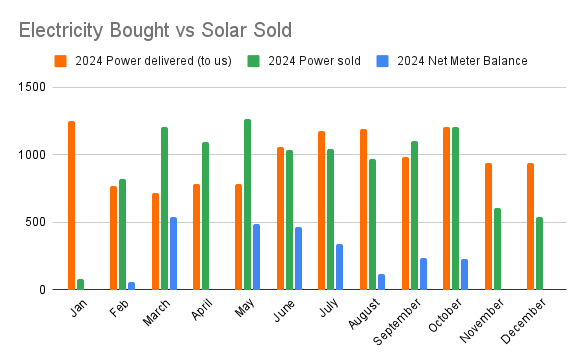
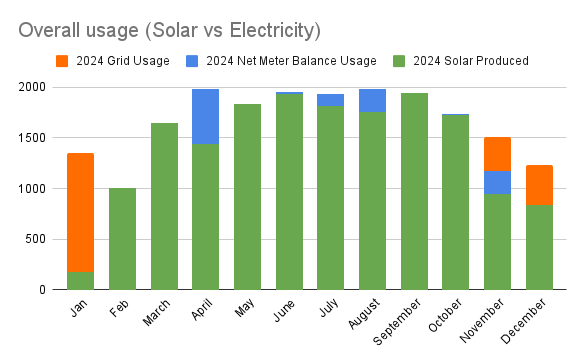
Chart shows overall month cost if we didn’t have solar and how much is covered by solar.

This chart shows overall usage month to month, how much solar we should make, and how much solar is produced. As you can see the summer months are higher then the winter months.
Hope you enjoy these types of post. If I am lacking anything let me know.
2 thoughts on “2024 Annual Solar Transparency Report”