At this point, I have now started a tradition to post my solar and electricity usage and metrics from the past year. If you would like to look at previous years here are the links
Here is the overall usage with visuals to see what was used from Solar, the grid, or net meter balance.
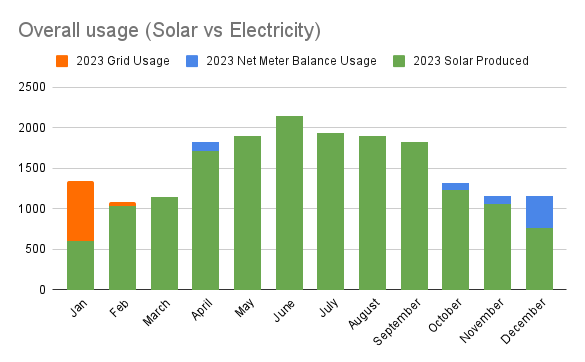
Since Alliant’s bills are not actual calendar months, this data is roughly from Dec 20th 2022 to Dec 19th 2023
- 1) Produced a total of 17.252MWh (Roughly the same as 2022)
- 2) Produced about 12% more then the overall estimate.
- 3) We used 12% less electricity this year, compared to 2022

- 4) Our average electric bill was $20.85 with the most expensive month was 111.62 (Snow Jan of 2023 that blocked the solar for a while)
- 5) Had a much higher net meter balance going into winter this year.
- 6) Current Rate of Return is about 6.5 years when taking into account the tax rebates.
Here is a chart for Electricity bought vs solar produced and sold back to the electric company and the net meter balance each month.
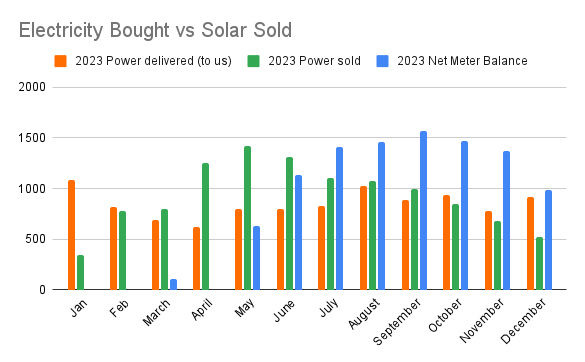
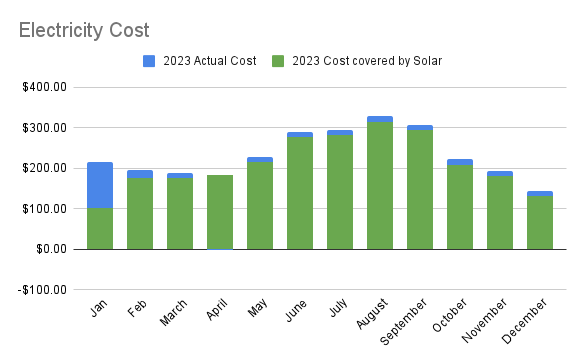
Chart shows overall month cost if we didn’t have solar and how much is covered by solar.
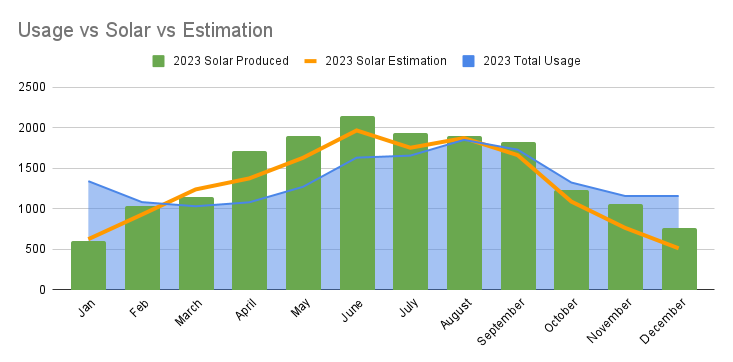
This chart shows overall usage month to month, how much solar we should make, and how much solar is produced. As you can see the summer months are higher then the winter months.
One thought on “2023 Annual Solar Transparency Report”